Tag Archives: weight loss

Do Diet Beverages Hinder Weight Loss?

ppp

That looks more like a beer than a diet soda bottle

Overweight and obese women who habitually drank diet beverages lost more weight if they substituted water for the diet beverage. Over the course of 24 weeks on a reduced calorie diet, the water drinkers lost an extra 1.2 kg (2.6 lb) compared to those who continued their diet beverage habit.

Furthermore, the researchers found that the water drinkers had healthier values on insulin levels, HOMA-IR (a measure of insulin resistance), and after-meal blood sugar levels.

I wonder if the sweet taste of diet drinks triggers an insulin release that inhibits fat-burning.

This was a small study with only about 30 in each experimental group. Whether similar results would be seen in men is unknown to me.

In the past, I’ve advised dieters it’s OK to drink diet drinks in moderation while trying to weight. I may have to revise my recommendations. On the other hand, if diet drinks help keep you happy and on a successful weight-loss journey, they may be helpful. The diet beverage consumers still lost 7.6 kg (16.7 lb) compared with 8.8 kg (19.4 lb) in the abstainers. But diets don’t work, right?

Steve Parker, M.D.

PS: I haven’t read the full text of the article; just the abstract.

PPS: Steven Novella at Science-Based Medicine blog concludes that low energy sweeteners probably help with weight control.

Diabetes Drug Liraglutide Going Mainstream, for Weight Loss

Just before Christmas last year, the U.S. Food and Drug Administration approved a new weight-loss drug: Saxenda. It’s the same drug—liraglutide or Victoza—they approved for treatment of diabetes in 2010.

Click for my brief review of the drug class for diabetics.

Click for the CBS News report on Saxenda. A snippet:

One clinical trial that involved patients without diabetes found that patients taking Saxenda had an average weight loss of 4.5 percent after one year. Of the people treated with the drug, 62 percent lost at least 5 percent of their body weight. Meanwhile, only 34 percent of those given an inactive placebo had the same result.

Another clinical trial that included patients with type 2 diabetes found that patients had an average weight loss of almost 4 percent after one year. Of those given Saxenda, 49 percent lost at least 5 percent of their body weight, compared to 16 percent of those who were given a placebo treatment.

Click for the FDA’s press release.

Oh, by the way. You have to inject it daily under the skin (subcutaneous). And if you were hoping for a shortcut to weight loss, this ain’t it. You’re still supposed to follow a reduced-calorie diet and exercise regularly.

I’d try the Paleobetic Diet first if I had diabetes. Lose excess weight and control blood sugars.

Steve Parker, M.D.

PS: Full prescribing information.

QOTD: J. Stanton on Weight Loss and Exercise

Let me be clear. Exercise is not important because it burns calories! Exercise without calorie restriction is a remarkably ineffective weight loss intervention, because it usually makes us hungry enough to replace the calories we burn. Exercise is important because it restores your ability to oxidize fat—both when fasting and after meals. And we can tie this in with mitochondrial dysfunction by noting that exercise is proven to increase mitochondrial volume.

J. Stanton

QOTD: James Fell on Weight Loss and Cooking

If you want to lose weight you need to cook. Period.

James Fell

The Mellberg Study: Paleo Diet and Obese Postmenopausal Women

Sweden's Flag. Most of the researchers involved with this study are in Sweden

Sweden’s Flag

Swedish researchers compared a Paleolithic-type diet against a lower-fat, higher-carb diet so often recommend in Nordic countries and in the U.S. Test subjects were obese but otherwise healthy older women. The study lasted two years. Dieters could eat as much as they wanted.

They found that the paleo-style dieters lost more weight, lost more abdominal fat, and lowered their trigyceride levels. When measured six months into the study, the paleo dieters had lost 6.5 kg (14 lb) of body fat compared to 2.6 (6 lb) kg in the other group.

Measured at two years out, the paleo dieters had lost 4.6 kg (10 lb) of body fat compared to 2.9 kg (6 lb) in the other group, but this difference wasn’t statistically significant.

The greatest weight loss was clocked at 12 months: Paleo dieters were down 8.7 (19 lb) kg compared to 4.4 kg (10 lb)  in the other group.

But this study was about more than weight loss. The investigators were also interested in cardiometabolic risk factors and overall body composition.

The Set-Up

I don’t know what the researchers told the women to get them interested. Weight loss versus healthier diet versus ?  This could have influenced the type of women who signed up, and their degree of commitment.

A newspaper ad got the attention of 210 women in Sweden; 70 met the inclusion criteria, which included a body mass index 27 or higher and generally good health. Average age was 60. Average BMI was 33. Average weight was 87 kg (192 lb). Average waist circumference was 105 cm (41 inches). The women were randomized into one of two diet groups (N=35 in each): paleolithic-type diet (PD) or Nordic Nutrition Recommendations diet (NNR). There were no limits on total caloric consumption. (Were the women told to “work on weight loss”? I have no idea.)

We don’t know the ethnicity of these women.

Here’s their version of the paleo diet:

  • 30% of energy (calories) from protein
  • 40% of energy from fat
  • 30% of energy from carbohydrate
  • high intake of mono- and polyunsaturated fatty acids
  • based on lean meat, fish, eggs, vegetables, fruits, berries, and nuts
  • additional fat sources were avocado and oils (rapeseed [canola] and olive) used in dressings and food preparation
  • cereals (grains), dairy products, added salt and refined fats and sugar were excluded
  • no mention of legumes, potatoes, or tubers

The NNR diet:

  • 15% of energy from protein
  • 25-30% of energy from fat
  • 55-60% of energy from carbohydrate
  • emphasis on high-fiber products and low-fat dairy products

Over the 24 months of the study, each cohort had 12 group meetings with a dietitian for education and support, including “dietary effects on health, behavioral changes and group discussion.”

Various blood tests and body measurements were made at baseline and periodically. Body measurements were made every six months. Body composition was measured by dual energy x-ray absorptiometry. Diet intake was measured by self-reported periodic four-day food records.

Stockholm Palace

Stockholm Palace

Results

30% of participants (21) eventually dropped out by the end of the study and were lost to follow-up, leaving 27 in the PD group and 22 in the NNR cohort.

Food record analysis indicated the PD group indeed reduced their carb intake while increasing protein and fat over baseline. Baseline macronutrient energy percentages were about the same for both groups: 17% protein, 45% carb, 34% (I guess the percentages don’t add to 100 because of alcohol, which wads not mentioned at all in the article.) Two years out, the PD group’s energy sources were 22% protein, 34% carb, 40% fat. For the NNR group, the energy sources at two years were 17% protein, 43% carb, and 34% fat. As usual, dietary compliance was better at six months compared to 24 months. The PD group failed to reach target amounts of protein energy (30%) at six and 24 months; the NNR group didn’t reach their goal of carbohydrate energy (55-60%). The PD group ate more mono- and poly unsaturated fatty acids than the NNRs.

In contrast to the food record estimates of protein intake, the urine tests for protein indicated poor adherence to the recommended protein consumption in the PD group (30% of energy). Both groups ate the same amount of protein by this metric. (This is an issue mostly ignored by authors, who don’t say which method is usually more accurate.)

“Both groups had statistically significant weight loss during the whole study, with significantly greater weight loos in the PD group at all follow up time points except at 24 months.” Largest weight loss was measured at 12 month: 8.7 kg (19 lb) in the PD group versus 4.4 kg (10 lb) in the NNRs.

The PD group lost 6.5 kg (14 lb) of body fat by six months but the loss was only 4.6 kg (10 lb) measured at 24 months. Corresponding numbers for the NNR group were 2.6 and 2.9 kg (about 6 lb). So both groups decreased their total fat mass to a significant degree. The difference between the groups was significant (P<0.001) only at six months. The greatest weight loss was clocked at 12 months: PD dieters were down 8.7 kg (19 lb) compared to 4.4 kg (10 lb) in the NNRs. Both groups saw a significant decrease in waist circumference during the whole study, with a more pronounce decrease in the PD group at six months: 11 versus 6 cm (4.3 versus 2.4 inches).

Fasting blood sugars, fasting insulin levels, and tissue plasminogen activator activity didn’t change.

Both groups had improvements in blood pressure, heart rate, c-reactive protein, LDL cholesterol, PAI-1 activity, and total cholesterol. The PD group saw a greater drop in triglycerides (by 19% at two years, but levels were normal to start with at 108 mg/dl or 1.22 mmol/l).

Reported daily energy intake fell over time for both groups, without statistically significant differences between them.

paleo diet, Steve Parker MD, diabetic diet

Sweet potato chunks brushed with olive oil, salt, pepper, and rosemary. Ready for the oven.

Discussion

As measured at six months, the paleo dieters lost 10% of their initial body weight, compared to 5% in the NNR group. That’s worth something to many folks. However, the researchers didn’t find much, if any, difference in the groups in terms of cardiometabolic risk factors. They wonder if that reflects the baseline healthiness of these women. Would a sicker study population show more improvement on one of the diets?

I’m surprised the NNR group lost any weight at all. In my experience it’s hard for most folks to lose weight and keep it off while eating as much as they want, unless they’re eating very-low-carb. We’ve seen short-term weight loss with ad libitum paleo diets before (here for example, and here, and here). I bet the women signing up for this study were highly motivated to change. 

Legumes and potatoes are a debatable part of the paleo diet. Most versions exclude legumes. We don’t know if these women ate legumes and potatoes. Other than this oversight, the study paleo diet is reasonable.

The authors noted that the paleo diet group failed to reach their protein intake goal (30% of total calories), and suggested reasons “such as protein-rich foods being more expensive, social influences on women’s food choices or a lower food preference for protein-rich food among women.”

The results of this study may or may not apply to other population subgroups and non-Swedes.

The authors write:

In conclusion, a Palaeolithic-type diet during two years with ad libitum intake of macronutrients, including an increased intake of polyunsaturated fatty acids and monounsaturated fatty acids reduces fat mass and abdominal obesity with significantly better long-term effect on triglyceride levels vs an NNR diet. Adherence to the prescribed protein intake was poor in the PD group suggesting that other component of the PD diet are of greater importance.

Does this study have anything to do with diabetes? Not directly. But it suggests that if an overweight diabetic needs to lose excess body fat without strict calorie control, a lower-carb paleo-style diet may be more effective than a low-fat, higher-carb diet. I would have liked to have seen lower fasting blood sugar and insulin levels in the paleo dieters, but wishing doesn’t make it so.

Steve Parker, M.D.

PS: Carbsane Evelyn has taken a look at this study and blogged about it here and here. I’ve not read those yet, but will now.

Reference: Mellberg, C., et al (including M. Ryberg and T Olsson). Long-term effects of a Palaeolithic-type diet in obese postmenopausal women: a 2-year randomized trial. European Journal of Clinical Nutrition, advance online publication January 29, 2014. doi: 10.1038/ejcn.2013.290

Dr. Roy Taylor on the Cause of Type 2 Diabetes and What To Do About It

diabetic diet, low-carb Mediterranean Diet, low-carb, Conquer Diabetes and Prediabetes

Warning: this is a sciencey post

According to Roy Taylor, M.D., “type 2 diabetes is a potentially reversible metabolic state precipitated by the single cause of chronic excess intraorgan fat.” The organs accumulating fat are the pancreas and liver. He is certain “…that the disease process can be halted with restoration of normal carbohydrate and fat metabolism.” I read Taylor’s article published last year in Diabetes Care.

(Do you remember that report in 2011 touting cure of T2 diabetes with a very low calorie diet? Taylor was the leader. The study involved only 11 patients, eating 600 calories a day for eight weeks.)

Dr. Taylor says that severe calorie restriction is similar to the effect of bariatric surgery in curing or controlling diabetes. Within a week of either intervention, liver fat content is greatly reduced, liver insulin sensitivity returns, and fasting blood sugar levels can return to normal. During the first eight weeks after intervention, pancreatic fat content falls, with associated steadily increasing rates of insulin secretion by the pancreas beta cells.

bariatric surgery, Steve Parker MD

Band Gastric Bypass Surgery (not the only type of gastric bypass): very successful at “curing” T2 diabetes if you survive the operation

Taylor’s ideas, by the way, dovetail with Roger Unger’s 2008 lipocentric theory of diabetes. Click for more ideas on the cause of T2 diabetes.

Here are some scattered points from Taylors article. He backs up most of them with references:

  • In T2 diabetes, improvement in fasting blood sugar reflects improved liver insulin sensitivity more than muscle insulin sensitivity.
  • The more fat accumulation in the liver, the less it is sensitive to insulin. If a T2 is treated with insulin, the required insulin dose is positively linked to how much fat is in the liver.
  • In a T2 who starts insulin injections, liver fat stores tend to decrease. That’s because of suppression of the body’s own insulin delivery from the pancreas to the liver via the portal vein.
  • Whether obese or not, those with higher circulating insulin levels “…have markedly increased rates of hepatic de novo lipogenesis.” That means their livers are making fat. That fat (triglycerides or triacylglycerol) will be either burned in the liver for energy (oxidized), pushed into the blood stream for use elsewhere, or stored in the liver. Fatty acids are components of triglycerides. Excessive fatty acid intermediaries in liver cells—diglycerides and ceramide—are thought to interfere with insulin’s action, i.e., contribute to insulin resistance in the liver.
  • “Fasting plasma glucose concentration depends entirely on the fasting rate of hepatic [liver] glucose production and, hence, on its sensitivity to suppression by insulin.”
  • Physical activity, low-calorie diets, and thiazolidinediones reduce the pancreas’ insulin output and reduce liver fat levels.
  • Most T2 diabetics have above-average liver fat content. MRI scans are more accurate than ultrasound for finding it.
  • T2 diabetics have on average only half of the pancreas beta cell mass of non-diabetics. As the years pass, more beta cells are lost. Is the a way to preserve these insulin-producing cells, or to increase their numbers? “…it is conceivable that removal of adverse factors could result in restoration of normal beta cell number, even late in the disease.”
  • “Chronic exposure of [pancreatic] beta cells to triacylglycerol [triglycerides] or fatty acids…decreases beta cell capacity to respond to an acute increase in glucose levels.” In test tubes, fatty acids inhibit formation of new beta cells, an effect enhanced by increased glucose concentration.
  • There’s a fair amount of overlap in pancreas fat content comparing T2 diabetics and non-diabetics. It may be that people with T2 diabetes are somehow more susceptible to adverse effects of the fat via genetic and epigenetic factors.
  • “If a person has type 2 diabetes, there is more fat in the liver and pancreas than he or she can cope with.”
  • Here’s Dr. Taylor’s Twin Cycle Hypothesis of Etiology of Type 2 Diabetes: “The accumulation of fat in liver and secondarily in the pancreas will lead to self-reinforcing cycles that interact to bring about type 2 diabetes. Fatty liver leads to impaired fasting glucose metabolism and increases export of VLDL triacylglcerol [triglycerides], which increases fat delivery to all tissues, including the [pancreas] islets. The liver and pancreas cycles drive onward after diagnosis with steadily decreasing beta cell function. However, of note, observations of the reversal of type 2 diabetes confirm that if the primary influence of positive calorie balance is removed, the the processes are reversible.”
diabetic diet, etiology of type 2 diabetes, Roy Taylor, type 2 diabetes reversal

Figure 6 from the article: Dr. Taylor’s Twin Cycle Hypothesis of Etiology of Type 2 Diabetes

  • The caption with Figure 6 states: “During long-term intake of more calories than are expended each day, any excess carbohydrate must undergo de novo lipogenesis [creation of fat], which particularly promotes fat accumulation in the liver.”
  • “The extent of weight gloss required to reverse type 2 diabetes is much greater than conventionally advised.” We’re looking at around 15 kg (33 lb) or 20% of body weight, assuming the patient is obese to start.  “The initial major loss of body weight demands a substantial reduction in energy intake. After weight loss, steady weight is most effectively achieved by a combination of dietary restriction and physical activity.”

Dr. Taylor doesn’t specify how much calorie restriction he recommends, but reading between the lines, I think he likes his 600 cals/day for eight weeks program. That will have a have a high drop-out rate. I suspect a variety of existing ketogenic diets may be just as successful and more realistic, even if it takes more than eight weeks. I wonder how many of the 11 “cures” from the 2011 study have persisted.

Steve Parker, M.D.

Reference: Taylor, Roy. Type 2 diabetes: Etiology and reversibility. Diabetes Care, April 2013, vol. 36, no. 4, pp:1047-1055.

Update: Some wild and crazy guys tried the Taylor method at home. Click for results.

David Mendosa On Weight Loss and Long-Term Management

Maybe his method works only for him, but I doubt it. David has diabetes, by the way. See his 2012 article at HealthCentral for details. Here’s a bit:

One cornerstone of this new way to lose weight and maintain weight loss is a twist on a standard dieting recommendation. But instead of weighing myself once a week, I weigh myself every morning.

Supposedly people get discouraged from daily weigh-ins because our weight seems to fluctuate up or down a couple of pounds every day for no good reason, or for at least for no reason that we can figure out. The fluctuations are certainly true in my experience. But, of course, the same fluctuations happen when we make our weigh-ins once a week, and that would be even more misleading.

Then, when the scales tell me that my weight is up that morning from the previous morning, I make an immediate course correction, which we know is easier in the long run than to wait until things get totally out of hand. My immediate course correction is simple. I skip dinner that day.

Note well, however, that skipping dinner could lead to major hypoglycemia if you’re taking certain diabetes drugs. Work with your personal healthcare provider on drug dose adjustments.

Steve Parker, M.D.

Ryberg et al: Effects of Paleolithic Diet on Obese Postmenopausal Women

Sweden's Flag. Most of the researchers involved with this study are in Sweden

Sweden’s Flag

After menopause, body fat in women tends to accumulate more centrally than peripherally. This is reflected in a higher incidence of fatty liver disease, type 2 diabetes, and cardiovascular disease. A multinational group of researchers wondered if a modified paleo-style diet would have metabolic effects on healthy overweight and obese (BMI 28–35) postmenopausal women in Sweden, with particular attention to fat levels in liver and muscle. I’ll call this the Ryberg study because that’s the first named author.

Study Details

Curiously, they never give the age range of the 10 study participants. Were they closer to 52 or 82?

tuna, fishing, Steve Parker MD, paleo diet, tuna salad

Has anyone even bothered to ask why the tuna are eating mercury? —Jim Gaffigan

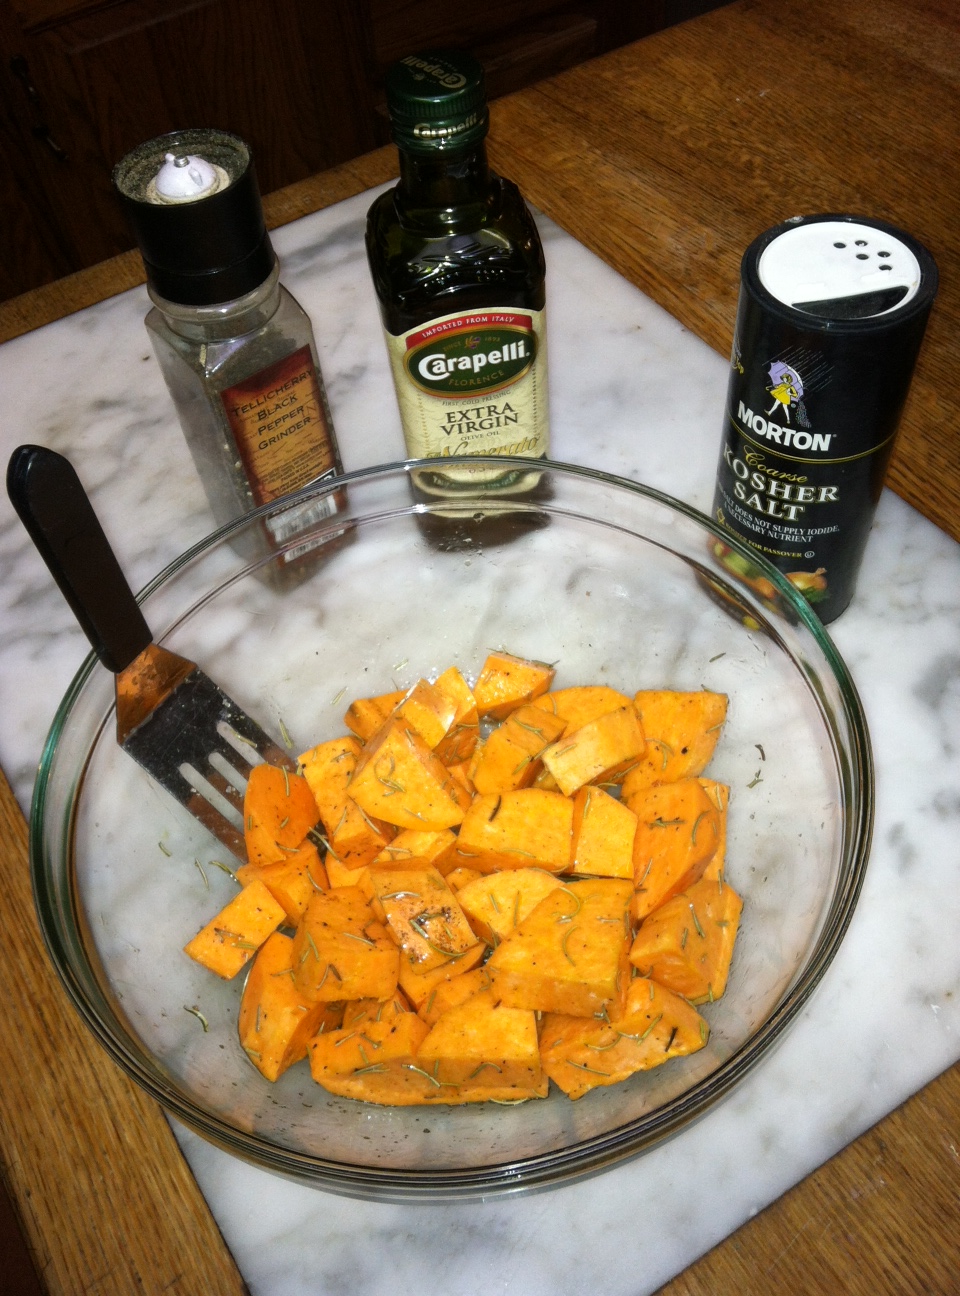
The five-week intervention diet seems to have been mostly prepared and provided by the investigators, but they allowed for home cooking by providing menus, recipes, and a food list. No limit on consumption. The goal was to obtain 30% of calories from protein, 40% from fat (mostly unsaturated), and 30% from carbohydrate “…together with 40 g nuts (walnuts and sweet almonds) on a daily basis….”

The diet included lean meat, fish, fruit, vegetables (including root vegetables), eggs and nuts. Dairy products, cereals, beans, refined fats and sugar, added salt, bakery products and soft drinks were excluded.

“They were also advised to use only rapeseed [i.e., canola] or olive oil in food preparation.”

A diet like this should reduce average saturated fat consumption, which was a stated goal, while substituting monounsaturated  and polyunsaturated fat for saturated.

These women were sedentary before and during the intervention.

Results

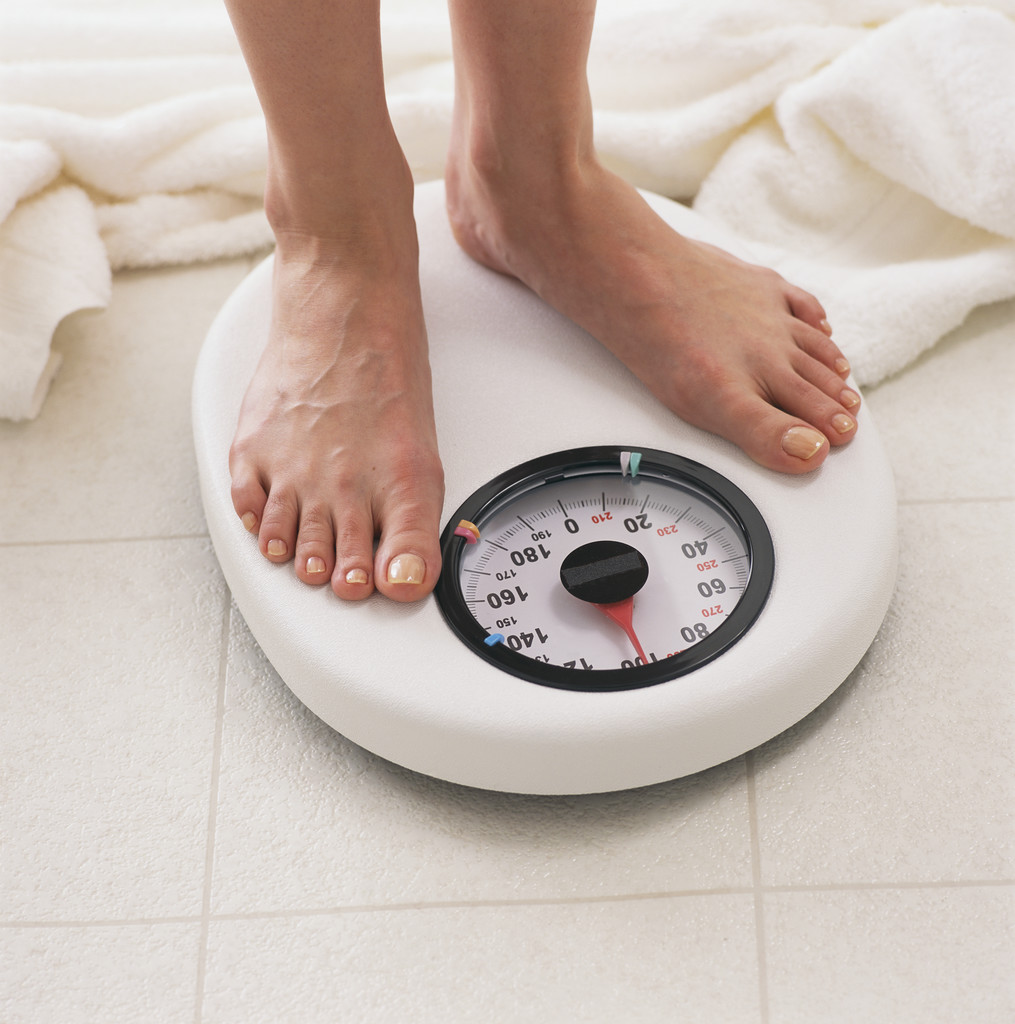
The ladies indeed made some major changes in their diet. Total calories consumed fell by 22% (2,400 to 1,900 cals). The average weight of participants dropped from 190 lb (86.4 kg) to 180 lb (81.8 kg).

Carbohydrates consumption as a percentage of total calories fell from 49% to 25%. Total carb  grams dropped from 281 to 118, with fiber grams unchanged. To replace some of the carbs, the women increased their protein and fat calorie percentages by about a third. The authors don’t make it clear whether the total carb grams included total fiber grams. (I could probably figure it out if I had the time and inclination, but don’t.) “Before” and “after” fiber grams were 25 and 27, respectively.

In other words, “…the ratio between energy intake from the macronutrients protein, total fat and carbohydrates expressed as E% [calorie percentages] changed significantly from 16:33:50 at baseline to 28:44:25 after five weeks.” Total daily fat grams didn’t change, but the contribution of saturated fat grams fell.

Elevated blood pressure is one component of metabolic syndrome

Elevated blood pressure is one component of metabolic syndrome

A 10-point drop in systolic blood pressure over the five weeks didn’t quite reach statistical significance (p=0.057), but the 9% drop in diastolic pressure did.

“Fasting serum levels of glucose, leptin, cholesterol, triglycerides, HDL, LDL, ApoB and apolipoprotein A1 (ApoA1) and percentage HDL also decreased significantly.”

Fat (or lipid) content of the liver dropped by half. It was measured by magnetic resonance spectroscopy. Peripheral muscle fat content didn’t change, measured in the soleus and  tibialis anterior muscles of the leg.

Urinary C-peptide excretion and HOMA indices [HOMA1-IR formula] decreased significantly, whereas whole-body insulin sensitivity, measured using the hyperinsulinaemic euglycaemic clamp technique, was not significantly changed.” See footnote labelled PPS at bottom page for confusing details.

My Comments

The intervention diet was a reasonable version of the Paleolithic diet, with one exception. From what I’ve seen from Eaton, Konner, and Cordain, I think they’d agree. Except for the rapeseed oil. It’s fallen out of favor, hasn’t it?

Here’s what the Jaminet’s wrote about canola:

Canola oil…is rapeseed oil bred and processed to remove erucic acid and glucosinolates. During processing, the oil is treated with the solvent hexane and very high temperatures; it may also be subject to caustic refinement, bleaching, and degumming. [Perfect Health Diet, p.225.]

I can’t quite see Grok doing that.

My fantasy about extra virgin olive oil is that it simply oozes out of the olives when pressure is applied. So easy a caveman could do it.

Eaton and Konner have argued that our ancestral diet would have had at least two or three times the fiber as was provided by this diet. But that would have been at a total daily calorie consumption level of at least 3,000 or 3,5oo back in the day. So this diet isn’t so far off.

10-lb Weight Loss Without Calorie Restriction? I'll Take That.

10-lb weight loss In five weeks without conscious calorie restriction? I’ll take that.

The 10 lb (4.6 kg) weight loss is impressive for an eat-all-you-want diet. Calorie intake dropped spontaneously by 500/day, assuming the numbers are accurate. The satiation from higher protein consumption may explain that. The authors admit that the women lost more weight than would be predicted by the energy balance equation (i.e., a pound of fat = 3,500 calories). They wonder about over-estimations of food intake, thermogenic effects of protein versus other macronutrients,  and loss of glycogen (and associated body water). You can’t argue with those scales, though.

While serum C-peptide didn’t fall, urinary levels did. (My sense from reviewing other literature is that 24-hr urine levels of C-peptide are more accurate indicators of insulin production, compared to a single fasting C-peptide level.) The authors interpret this as increased insulin sensitivity in the liver in combination with decreased insulin secretion by the pancreas. Fasting serum insulin levels fell from 8.35 to 6.75 mIU/l (p<0.05).

Regarding the non-significant change in overall insulin sensitivity as judged by hyperinsulinemic euglycemic clamp technique, remember that insulin sensitivity of the liver may be different from sensitivity in peripheral tissues such as muscle. These investigators think that liver insulin sensitivity was clearly improved with their diet.

Blood lipid changes were in the right direction in terms of cardiovascular disease risk, except for the drops in HDL (from 1.35 to 1.17 mmol/l) and ApoA1.

This study may or may not apply to men. Also note the small sample size. Will these results be reproducible in a larger population? In different ethnicities?

I like the reduction in blood pressure. That could help you avoid the risk, expense, and hassle of drug therapy.

From 97 to 90 mg/dl

Serum glucose fell from 96  to 90 mg/dl

I like the drop in fasting blood sugar from 96 to 90 mg/dl (5.35 to 5 mmol/l). It’s modest, but statistically significant. Was it caused by the weight loss, reduced total carb consumption, paucity of sugar and refined starches, lower total calories, higher consumption of protein and mono- and polyunsaturated fats, or a combination of factors? As with most nutritional studies, there’s a lot going on here. A small fasting blood sugar drop like this wouldn’t matter to most type 2 diabetics, but could diabetics see an even greater reduction than these non-diabetics? Only one way to tell: do the study.

I can well imagine this diet curing some cases of metabolic syndrome, prediabetes, mild type 2 diabetes, and fatty liver disease.

Most type 2 diabetics (and prediabetics, for that matter) are overweight or obese.  If a diet like this helps them lose weight, it could improve blood sugar levels. Nearly all authorities recommend that overweight and obese diabetics and prediabetics get their weight down to normal. (I admit that weight loss and improved blood sugar levels are not always in sync.) Weight loss by any standard method tends to improve insulin sensitivity.

Furthermore, the elevated fasting blood sugars that characterize so many cases of diabetes and prediabetes are usually linked to, if not caused by, insulin resistance in the liver. According to these investigators, the diet at hand improves insulin sensitivity in the liver, and even lowers fasting blood sugars in non-diabetic older women.

This modified Paleolithic-style diet doesn’t include table sugar or refined grain starches. That would help control blood sugar levels in both type 1 and type 2 diabetics and prediabetics. The authors didn’t say so, but this must be a relatively low-glcemic-index diet.

The investigators don’t mention ramifications of their diet for folks with diabetes. Their focus is on ectopic fat accumulation (in liver and muscle) and its linkage with insulin resistance and cardiovascular disease. They’ve put together a promising program to try on diabetics or prediabetics. They just need the will and funding to git’r done.

I agree with the authors that the lower calorie consumption, rather than the paleo diet per se, may have caused or contributed to the reduction in liver fat.

Stockholm Palace

Stockholm Palace

The investigators wonder if a Paleolithic-style diet like this would be beneficial over the long-term in patients with non-alcoholic fatty liver disease (NALFD) and associated metabolic disturbance (e.g., impaired sensitivity sensitivity in the liver). NAFLD tends to predict the development of diabetes and cardiovascular disease. If we can prevent or reverse fatty liver, we may prevent or reverse type 2 diabetes and cardiovascular disease, to an extent. You’ll be waiting many years for those clinical study results.

But you have to decide what to eat today.

A significant number of American women (20%?) need to lose weight, lower their blood pressures, lower their blood sugars, and decrease their liver fat. This Ryberg Paleolithic-style diet would probably do it.

A very-low-carb diet is another way to reduce liver fat, and it’s more effective than simple calorie restriction.

Steve Parker, M.D.

Reference: Ryberg, M., et al. A Palaeolithic-type diet causes strong tissue-specific effects on ectopic fat deposition in obese postmenopausal women. Journal of Internal Medicine, 2013, vol. 274(1), pp: 67-76.  doi: 10.1111/joim.12048

PS: See Carbsane Evelyn for her take on this study here and here.

PPS: Urinary C-peptide secretion reflects insulin production. HOMA is a gauge of insulin resistance, much cheaper and quicker than the purported “gold-standard” hyperinsulinemic euglycemic clamp technique. Why HOMA and the clamp technique in this study didn’t move together is unclear to me, and the authors didn’t explain it. School me in the comment section if you can. Click this HOMA link and you’ll find this statement: “HOMA and clamps yield steady-state measures of insulin secretion and insulin sensitivity in the basal and maximally stimulated states, respectively. HOMA measures basal function at the nadir of the dose-response curve, whereas clamps are an assessment of the stimulated extreme.” Maybe that means HOMA is applicable to the fasted state (no food for 8 hours), whereas the clamp technique is more applicable to the hour or two after you ate half a dozen donuts.

Week 2 Recap of the Parker Paleo Diet Trial

It’s going well.  (Click for the Parker version of paleo.)

Overton trail at Cave Creek Regional Park, Arizona

Only one transgression.  I attended my son’s Boy Scout troop campout last weekend and had some salad with a small amount of cheese and salad dressing made from industrial seed oil.  Not a big deal.

These campouts are often carb-heavy affairs involving copious grains and refined sugars.  The adults get together on meals so there’s usually some compromise involved.  We always have meat or eggs at mealtimes, along with fresh fruit.  It’s not too hard to eat paleo, particularly if I bring some nuts.  I was sorely tempted by blueberry muffins, white chocolate/macadamia nut cookies, and oatmeal raisin cookies.

Although I’m not trying the paleo diet to lose weight, I lost 3.5 lb (1.6 kg) in the last week, adding to the 1.5 lb I lost in the first week.  Starting weight was 171 lb and I’m down to 166.  I gotta admit I’m pleasantly surprised.  I haven’t even been exercising for the last couple weeks.

—Steve

PS: The paleo diet is also known as the Paleolithic, Stone Age, Old Stone Age, hunter-gatherer, or caveman diet.

Hamburger, mixed veggies, raw cucumbers

Go John trail at Cave Creek Regional Park, Arizona, where the troop camped

Rosemary Chicken (garnished with pico de gallo) and Rosemary Roasted Potatoes

Weight-Loss Stalls

Left, right, or straight ahead (the road less travelled)?

It’s common on any weight-loss program to be cruising along losing weight as expected, then suddenly the weight loss stops although you’re still far from goal weight.  This is the infamous and mysterious stall.

Once you know the reason for the stall the way to break it becomes obvious.  The most common reasons are:

  1. You’re not really following the full program any more; you’ve drifted off the path, often unconsciously
  2. Instead of eating just until you’re full or satisfied, you’re stuffing yourself
  3. You need to start or intensify an exercise program
  4. You’ve developed an interfering medical problem such as adrenal insufficiency (rare) or an underactive thyroid; see your doctor
  5. You’re taking interfering medication such as a steroid; see your doctor
  6. Your strength training program is building new muscle that masks ongoing loss of fat (not a problem!)

If you still can’t figure out what’s causing your stall, do a nutritional analysis of one weeks’ worth of eating, with a focus on total calories.  You can do this analysis online at places like FitDay (http://fitday.com/) or Calorie Count (http://caloriecount.about.com/).  You may be surprised to find out you’re eating a lot more calories than you thought.  Assuming you indeed have excess fat to lose, you can break your stall by cutting your total daily calorie intake by 400–500.  Try it for a week or two.

Steve Parker, M.D.